NOTE
4.2 pprof
1. pprof是什么 Golang的性能分析工具。 2. 如何使用pprof 有两个库: runtime/pprof :采集工具型应用运行数据进行分析 net/http/pprof :采集web应用运行时数据进行分析 benchmark :压测 2.1. runtime/pprof 2.1.1.
这是历史学习笔记,可能存在过时或不完整的理解。
1. pprof是什么
Golang的性能分析工具。
2. 如何使用pprof
有两个库:
runtime/pprof:采集工具型应用运行数据进行分析
net/http/pprof:采集web应用运行时数据进行分析
benchmark:压测
2.1. runtime/pprof
2.1.1. CPU分析
假设应用如下:
import (
	"fmt"
	"time"
)

// 一段有问题的代码
func logicCode() {
	var c chan int
	for {
		select {
		case v := <-c:
			fmt.Printf("recv from chan, value:%v\n", v)
		default:
		}
	}
}

func main() {
	for i := 0; i < 8; i++ {
		go logicCode()
	}
	time.Sleep(20 * time.Second)
}
如果要开启CPU分析,那么步骤如下:
- 导入包
import "runtime/pprof" - 开启CPU性能分析:
pprof.StartCPUProfile(w io.Writer)+停止CPU性能分析:pprof.StopCPUProfile()代码如下
import (
	"fmt"
	"os"
	"runtime/pprof"
	"time"
)

// 一段有问题的代码
func logicCode() {
	var c chan int
	for {
		select {
		case v := <-c:
			fmt.Printf("recv from chan, value:%v\n", v)
		default:
		}
	}
}

func main() {
	//开启CPU分析
	file, err := os.Create("./cpu.pprof")
	if err != nil {
		fmt.Printf("create cpu pprof failed, err:%v\n", err)
		return
	}
	pprof.StartCPUProfile(file)
	defer pprof.StopCPUProfile()

	for i := 0; i < 8; i++ {
		go logicCode()
	}
	time.Sleep(20 * time.Second)
}- 运行代码生成报告
- 命令行分析
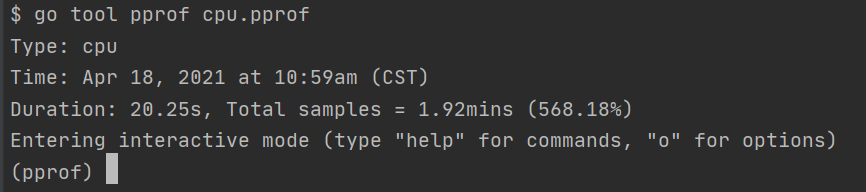
go tool pprof cpu.pprof- 几个比较重要的命令:
top:找出我们写的代码中占用CPU高的函数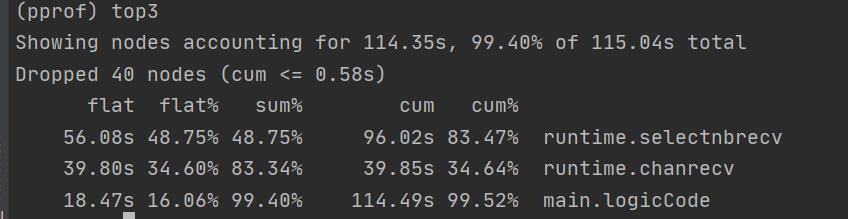
- flat:当前函数占用CPU的耗时。举例来说,
runtime.selectnbrecv这个函数的耗时占用了56.08s,不包括调用子函数 - flat%::当前函数占用CPU的耗时百分比。举例来说,
runtime.selectnbrecv这个函数的耗时占用了CPU48.75%的时间,不包括调用子函数 - sum%:该函数及以上函数占用CPU的耗时累计百分比,即flat%的累加。举例来说,
mainlogicCode及以上的函数占用了48.75+34.60+16.06=99.41%的时间 - cum:当前函数加上当前函数调用的函数占用CPU的总耗时。举例来说,
runtime.selectnbrecv这个函数的耗时占用了96.02s,包括调用子函数。可以使用top -cum按照cum排序 - cum%:当前函数加上调用当前函数的函数占用CPU的总耗时百分比。举例来说,
runtime.selectnbrecv这个函数的耗时占用了CPU83.47%的时间,包括调用子函数 - 最后一列:函数名称
- flat:当前函数占用CPU的耗时。举例来说,
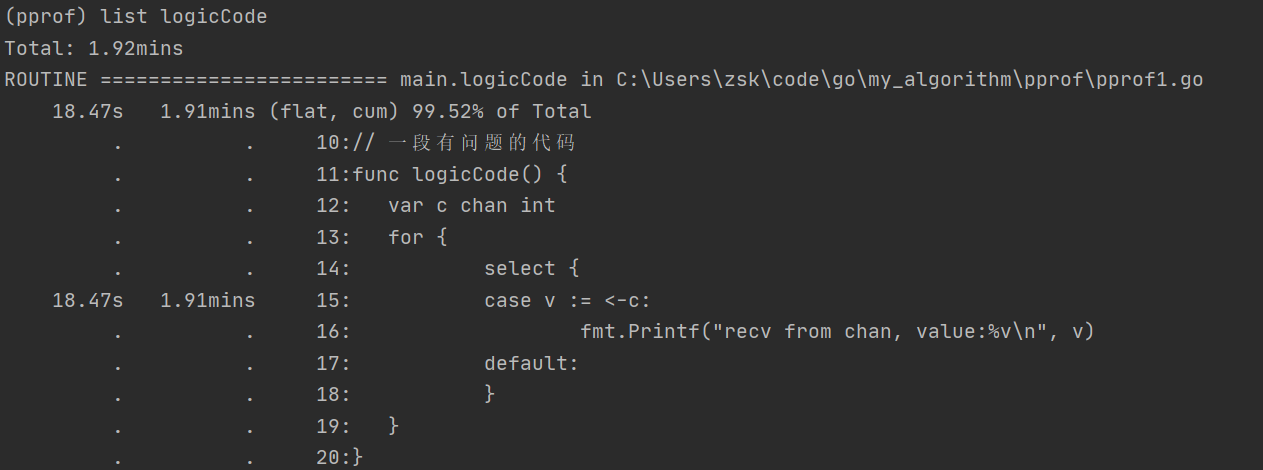
list函数名:查看源代码web:图形化方式查看报告(需要安装graphviz)
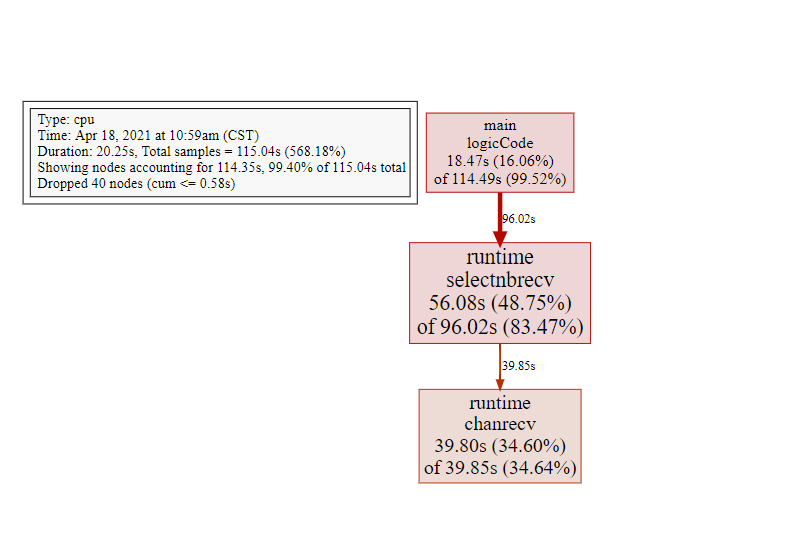
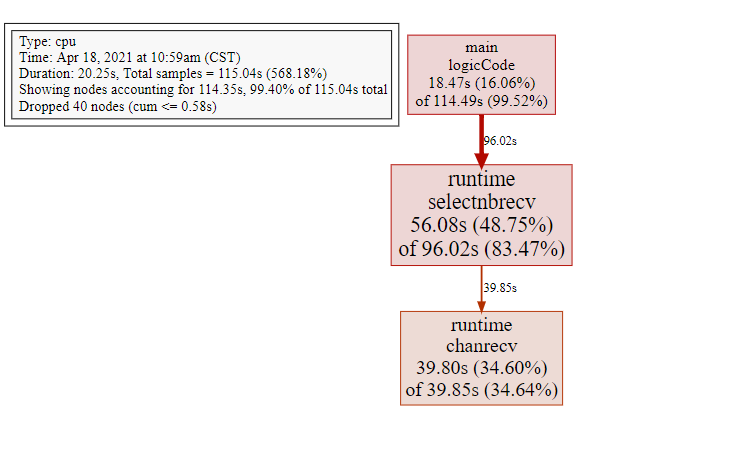
- Edge:调用
- 代表A调用B,其中虚线表示省略了中间一些不重要的函数调用
- 连线上的值表示该子函数耗时
- Node:函数
- CPU占用时间越多那么图形越大越红
- main.logicCode函数本身占用了18.47s,占比16.06%,该函数以及子函数占用了114.49s,占比99.52%
- Edge:调用
- 浏览器分析
go tool pprof -http=:9090 cpu.pprof- 其中的
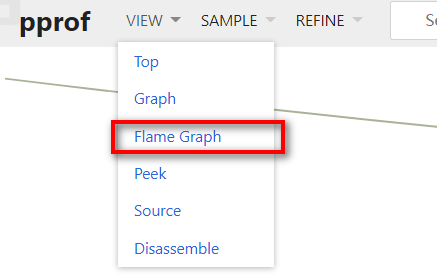 火焰图.md(关联笔记尚未公开)特别有用
- 修改代码

func logicCode() {
	var c chan int
	for {
		select {
		case v := <-c:
			fmt.Printf("recv from chan, value:%v\n", v)
		default:
			time.Sleep(time.Second)
		}
	}
}- 重新运行分析
- 可以看出没有我们写的代码占用高的情况了
2.1.2. 内存分析
步骤如下
- 导入包:
import "runtime/pprof" - 记录程序的堆栈信息:
pprof.WriteHeapProfile(w io.Writer)代码如下:
port (
	"fmt"
	"os"
	"runtime/pprof"
	"time"
)

func main() {
	//开启内存分析
	file, err := os.Create("./memory.pprof")
	if err != nil {
		fmt.Printf("create cpu pprof failed, err:%v\n", err)
		return
	}
	pprof.WriteHeapProfile(file)

	for i := 0; i < 8; i++ {
		go logicCode()
	}
	time.Sleep(20 * time.Second)
}- 运行代码生成报告
- 命令行分析
go tool pprof -inuse_space memory.pprofgo tool pprof -inuse_objects memory.pprof

2.1.3. 阻塞分析
In the Go programming language, what happens when a goroutine blocks? - Quora
2.2. net/http/pprof
假设Web应用如下:
func main() {
	go func() {
		http.ListenAndServe("0.0.0.0:9999", nil)
	}()
}
如果要开启分析,那么步骤如下:
- 导入包:
import _ "net/http/pprof"
import _ "net/http/pprof"
func main() {
	go func() {
		http.ListenAndServe("0.0.0.0:9999", nil)
	}()
}- 使用浏览器访问
http://127.0.0.1:9999/debug/pprof/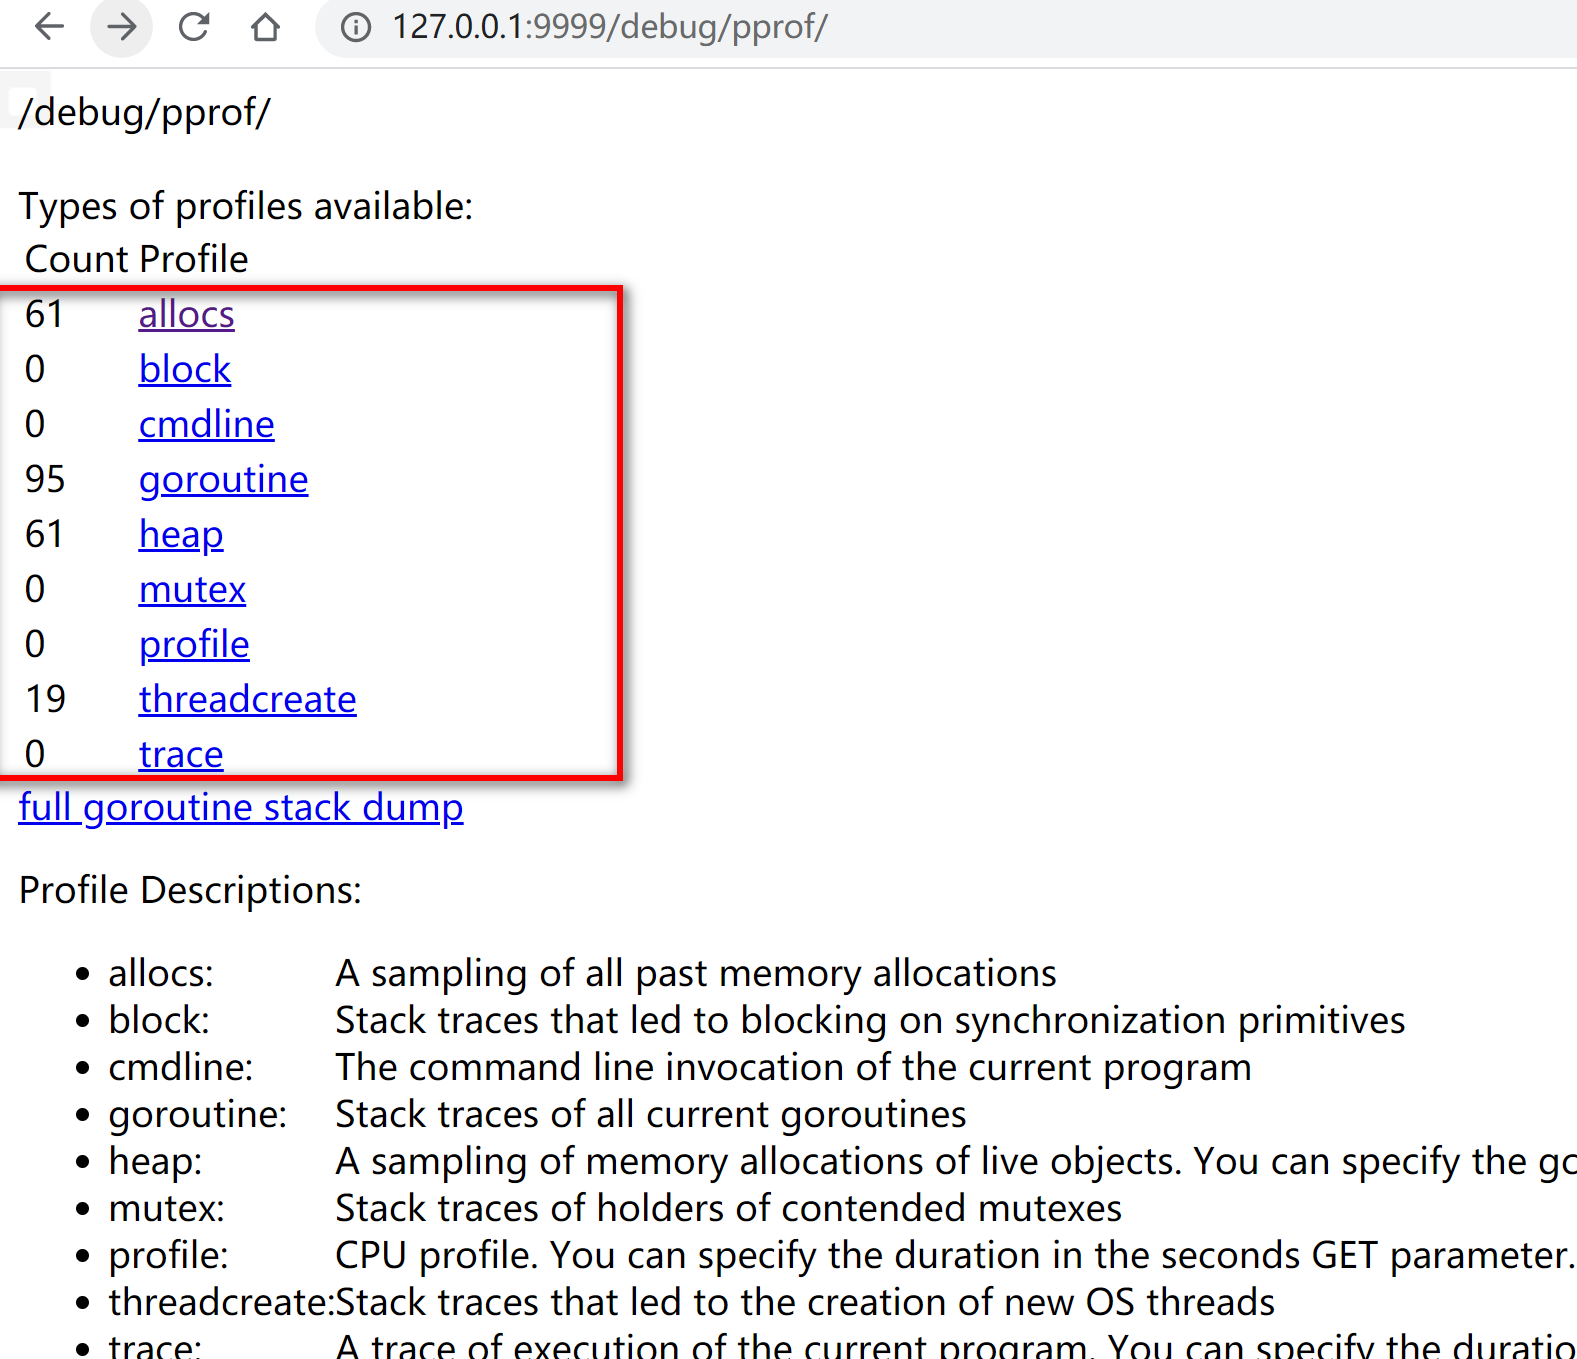
- 点击不同端点查看
- 内存:
allocs、heap - CPU:
profile - 线程:
threadcreate - 协程:
goroutine
- 内存:
- 除了用浏览器实时查看外,也可以用
go tool pprof查看不同端点
go tool pprof http://localhost:9999/debug/pprof/allocs
go tool pprof http://localhost:9999/debug/pprof/heap
go tool pprof http://localhost:9999/debug/pprof/goroutine
go tool pprof http://localhost:9999/debug/pprof/threadcreate
go tool pprof http://localhost:9999/debug/pprof/profile- 也可以保存当时的快照以便以后分析
curl http://localhost:9999/debug/pprof/allocs > allocs.out
curl http://localhost:9999/debug/pprof/heap > heap.out
curl http://localhost:9999/debug/pprof/goroutine > goroutine.out
curl http://localhost:9999/debug/pprof/threadcreate > threadcreate.out
curl http://localhost:9999/debug/pprof/profile > profile.out然后用go tool pprof分析,同工具型应用
2.3. benchmark
3. pprof原理
采样:开启之后每隔一段时间(10ms)收集堆栈信息,获取每个函数占用的CPU和内存等资源, 分析:通过对这些采样数据进行分析,形成一个性能分析报告
4. 参考
- 深度解密Go语言之pprof | qcrao
- Golang 大杀器之性能剖析 PProf - SegmentFault 思否
- Go性能调优 | 李文周的博客
- go pprof实战 - QQ音乐项目 - KM平台(内部链接已移除)
- 内存泄漏,8次goroutine泄漏,1次真正内存泄漏 - rsapaper_ing - 博客园
- golang pprof 实战 | Wolfogre’s Blog
- go pprof实战 - 云+社区 - 腾讯云
- 一文搞懂pprof_程序员麻辣烫的博客-CSDN博客_pprof
- 降本增效: 一种可节约30%CPU资源的tRPC-Go插件 - KM平台(内部链接已移除)
- tRPC-Go: 性能优化之路 - KM平台(内部链接已移除)
- How I investigated memory leaks in Go using pprof on a large codebase
- An Introduction to go tool trace
- pprof中flat和cum的区别_i-neojos的博客-CSDN博客
- linux - Pprof and golang - how to interpret a results? - Stack Overflow
- Profiling and Optimizing Go - YouTube
- Go Profiling and Optimization - Google 幻灯片
- Commits · prashantv/go_profiling_talk
- [golang]7种 Go 程序性能分析方法 - landv - 博客园
- golang 内存分析/动态追踪 — 源代码