
NOTE
2.1 Prometheus
Prometheus role, architecture, and core components.
This is a historical learning note and may contain outdated or incomplete understanding.
1. What Is Prometheus
- A metrics monitoring system.
2. Prometheus Architecture
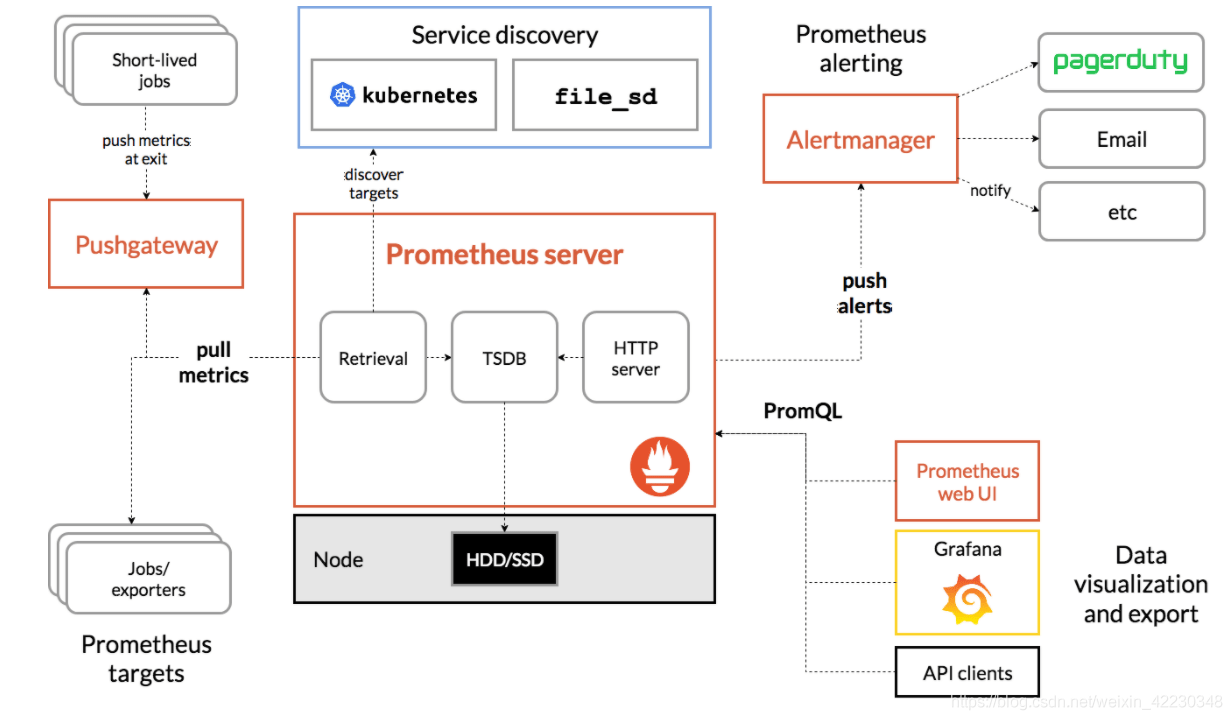
- Prometheus Server: primarily scrapes monitoring data over HTTP from exporters or instrumented targets and stores it in its local TSDB for querying and rule evaluation.
- Exporters: expose HTTP endpoints that Prometheus can scrape.
- Pushgateway: mainly intended for a limited set of cases such as short-lived, service-level batch jobs that cannot be scraped continuously. It is not a general-purpose proxy for every unreachable target.
- Alertmanager: after Prometheus evaluates alerting rules and emits alerts, Alertmanager handles grouping, inhibition, silences, and notifications such as email.
3. Prometheus Installation
See the Prometheus installation note.