
NOTE
3.1 Grafana
Grafana installation and basic Prometheus data-source usage.
This is a historical learning note and may contain outdated or incomplete understanding.
1. Download Grafana
- Download Grafana | Grafana Labs
- Choose the appropriate standalone binary/package for the operating system.
2. Extract and Start Grafana
For a standalone archive, follow the directory layout of the current release. A typical command is:
./bin/grafana server3. Open in the Browser
- http://localhost:3000/
- The first login normally uses the
adminuser; follow the current Grafana prompt for the initial password/change flow.
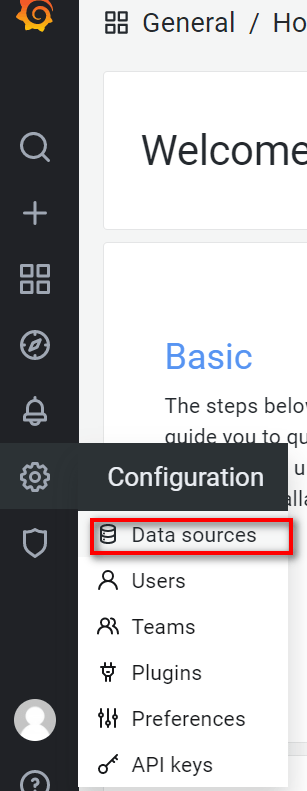
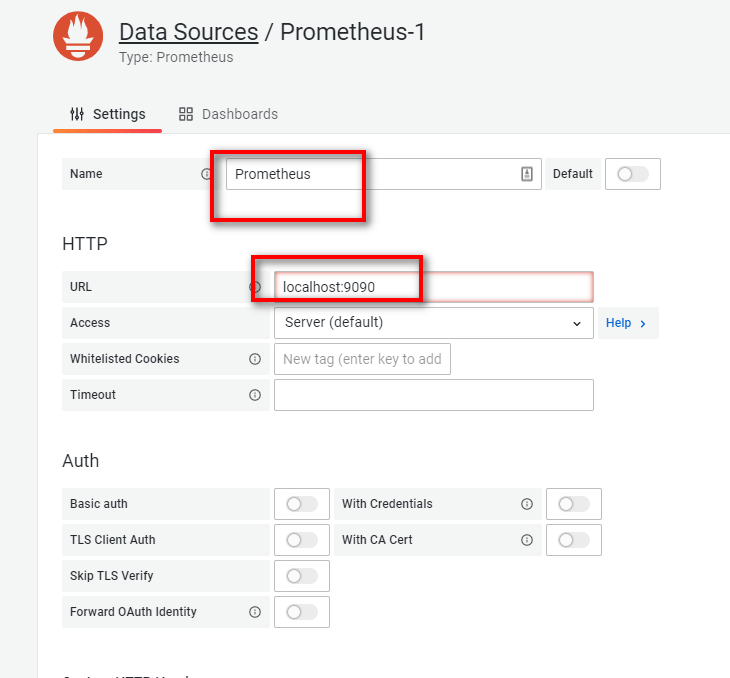
4. Add a Prometheus Data Source
4.1. Configure the Prometheus Data Source
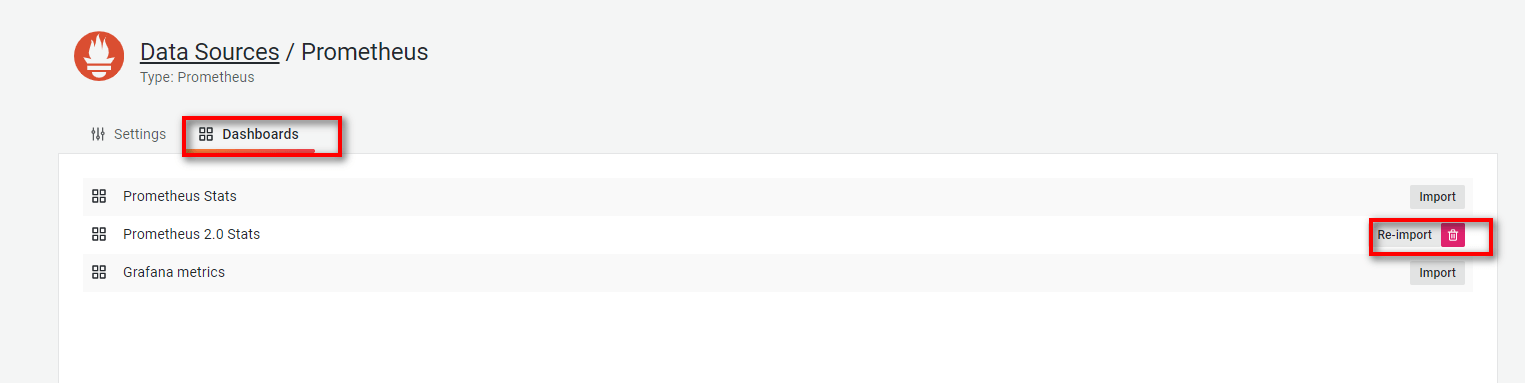
4.2. Import a Prometheus Dashboard/Data Source Configuration
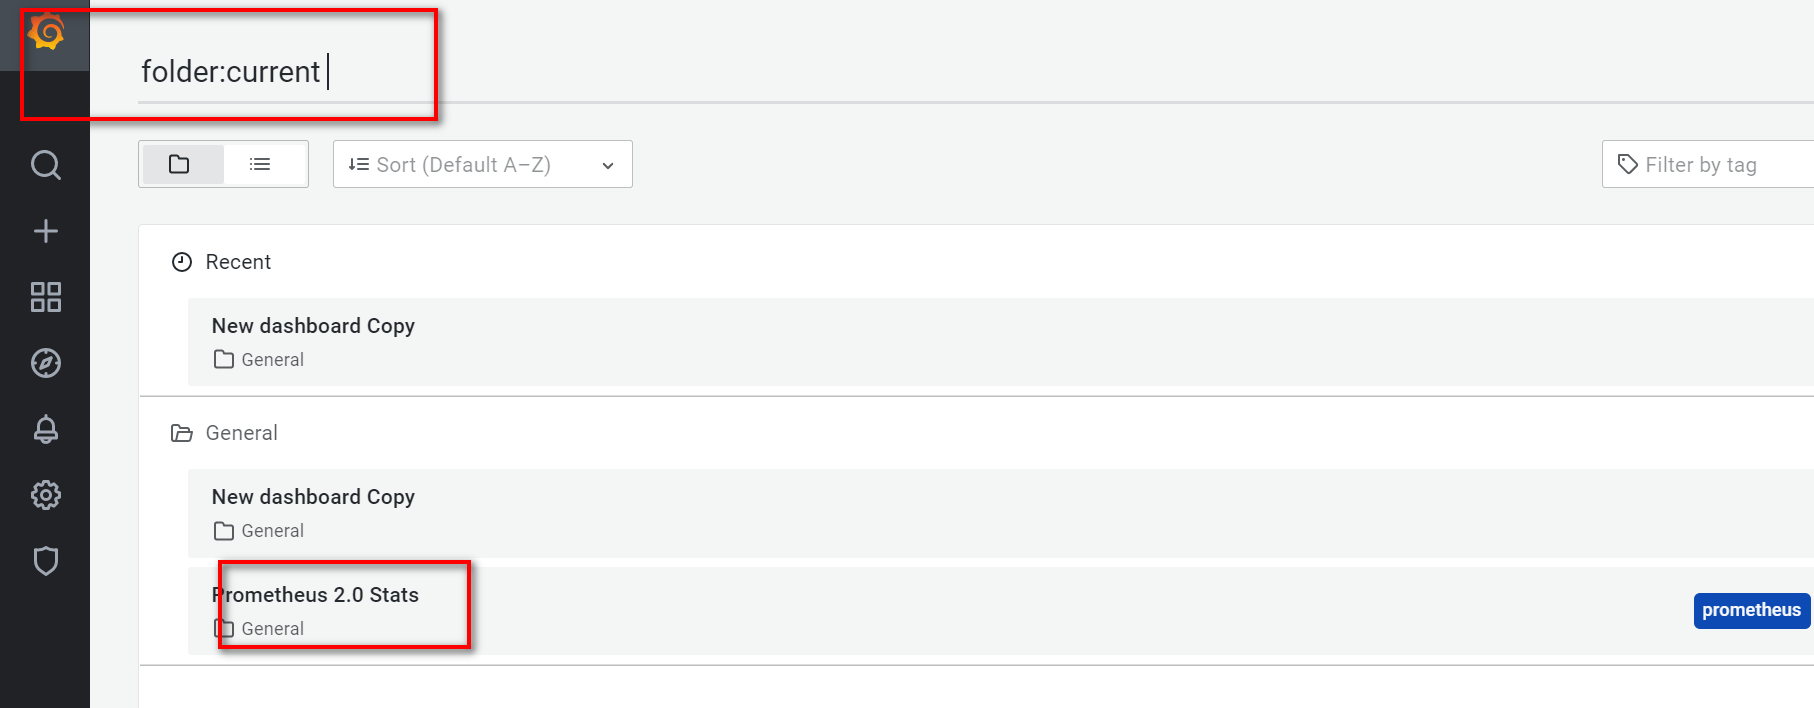
4.3. View the Prometheus Data Source
4.4. Edit a Panel
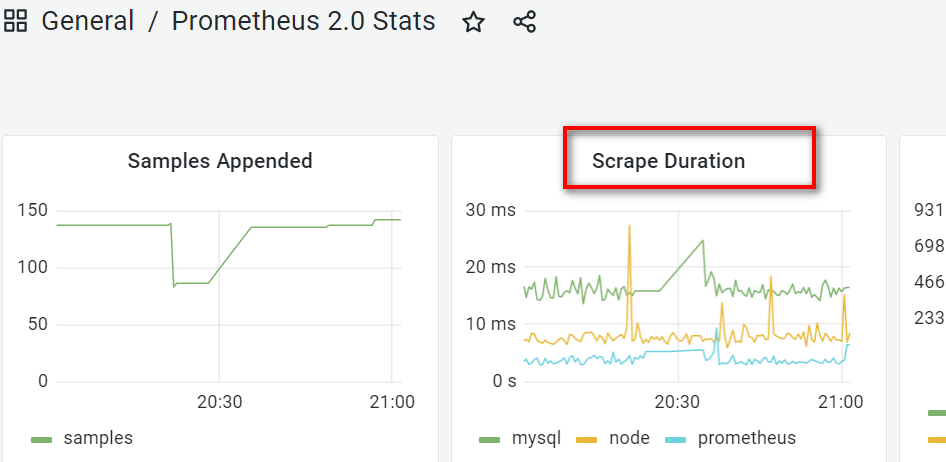
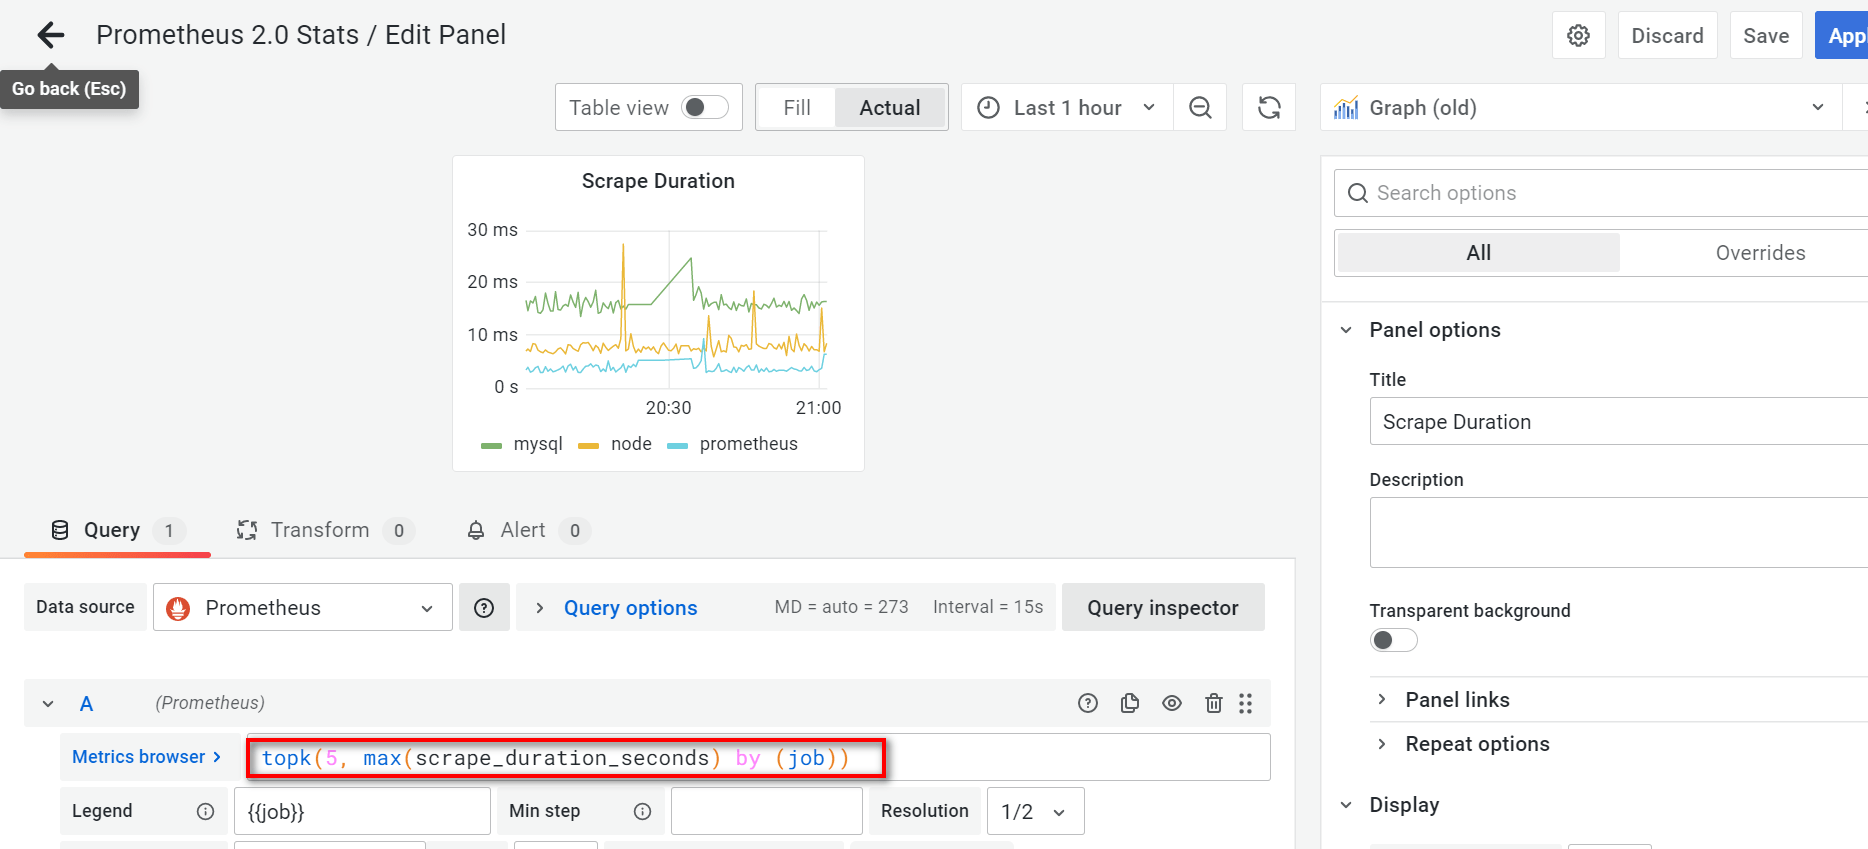
- The panel query is ultimately a query against the Prometheus data source.